做高性能服务器的时候,知道如何开发高性能代码是一个事情,开发出来的系统是不是高性能那就是另外一个事情了。
通常我们需要了解系统的CPU拓扑结构,内存使用情况,各种CPU性能计数器的数字,各种CPU Cache的使用情况,命中率等等信息,这些信息有效的结合在一起才能准确的分析出我们程序的缺陷,从而找到更好的优化点。 通常这些信息是散落在系统的各个地方,对于普通的开发人员很难汇总起来,形成合力。
好了,以精细出名的德国人又来帮忙了,隆重推出Likwid。
Likwid项目的地址在这里。 根据主页的上的描述:
Likwid stands for Like I knew what I am doing. This project contributes easy to use command line tools for Linux to support programmers in developing high performance multi threaded programs.
It contains the following tools:
likwid-topology: Show the thread and cache topology
likwid-perfctr: Measure hardware performance counters on Intel and AMD processors
likwid-features: Show and Toggle hardware prefetch control bits on Intel Core 2 processors
likwid-pin: Pin your threaded application without touching your code (supports pthreads, Intel OpenMP and gcc OpenMP)
likwid-bench: Benchmarking framework allowing rapid prototyping of threaded assembly kernels
likwid-mpirun: Script enabling simple and flexible pinning of MPI and MPI/threaded hybrid applications
likwid-perfscope: Frontend for likwid-perfctr timeline mode. Allows live plotting of performance metrics.
likwid-powermeter: Tool for accessing RAPL counters and query Turbo mode steps on Intel processor.
likwid-memsweeper: Tool to cleanup ccNUMA memory domains.
Likwid stands out because:
No kernel patching, any vanilla linux 2.6 or newer kernel works
Transparent, always clear which events are chosen, event tags have the same naming as in documentation
Lightweight, LIKWID tries to add no overhead and keeps out of your way.
Easy to use, simple to build, no need to touch your code, configurable from outside. Clear CLI interface.
Multiplatform, likwid supports Intel and AMD processors
Up to date, likwid tries to fully support new processors as soon as possible
Extensible, you can add functionality by means of simple text files
同时他的文档还是做的非常不错的,使用的介绍在这里
具体的使用我就不墨迹了,文档里面都有。我在这里秀下他的功能:
Read more…
随着PCI-E SSD卡的普及,很多高性能的服务器都用上了如fusionio这样的设备来提升IO的性能,这样会带来一些问题。 这些高速的IO设备在运作的时候会产生大量的中断来通知IO的完成,全速运转的系统上中断达到14000irqs/sec 如图:

而中断是默认摊到所有的CPU:
#cat /proc/irq/1/smp_affinity
ffffffff
在实践中来看会落在最繁忙的0核心上,这样就会给性能雪上加霜,效果如下:
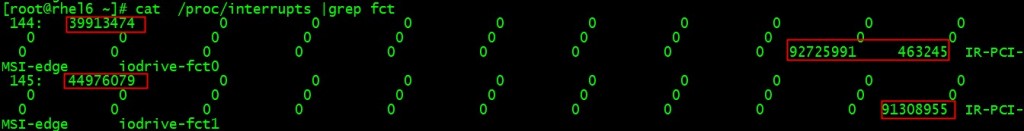
cat /proc/interrupts |grep fct
144: 39913474 0 0 0 0 0 0 0 0 0 0 0 0 0 0 0 0 0 0 0 0 0 0 0 0 0 0 0 0 0 0 0 IR-PCI-MSI-edge iodrive-fct0
145: 44976079 0 0 0 0 0 0 0 0 0 0 0 0 0 0 0 0 0 0 0 0 0 0 0 0 0 0 0 0 0 0 0 IR-PCI-MSI-edge iodrive-fct1
中断144,145属于iodrive-fct高速设备的,都落在了0号核心上。
对于大多数的高性能服务器通常都有16-32个核心,越靠后面的核心越闲,那为什么我们不把中断移到后面的核心,让核心0解放出来多做其他的事情呢?毕竟由于历史原因,很多东西还是在核心0上做的,减负!
这个问题的核心就是要设置/proc/N/145/smp_affinity的CPU掩码, 手工做比较麻烦。
好了,脚本来了:
# cat set_fio_affinity.sh
#!/bin/bash

set_affinity()
{
    MASK_TMP=$((1<<(`expr $VEC + $CORE`)))
    MASK=`printf "%X" $MASK_TMP`
    printf "%s mask=%s for /proc/irq/%d/smp_affinity\n" $DEV$VEC $MASK $IRQ
    printf "%s" $MASK > /proc/irq/$IRQ/smp_affinity
}


if [ $# -ne 1 ] ; then
    echo "usage:"
    echo "    $0 core "
    exit
fi

CORE=$1
DEV="iodrive-fct"
MAX=`grep -i $DEV /proc/interrupts | wc -l`
if [ "$MAX" == "0" ] ; then
    echo no $DIR vectors found on $DEV
    exit
fi

for VEC in `seq 0 1 $MAX`
do
    for IRQ in `cat /proc/interrupts | grep -i $DEV$VEC|cut  -d:  -f1| sed "s/ //g"`
    do
        set_affinity
    done
done

# ./set_fio_affinity.sh 30
iodrive-fct0 mask=40000000 for /proc/irq/144/smp_affinity
iodrive-fct1 mask=80000000 for /proc/irq/145/smp_affinity
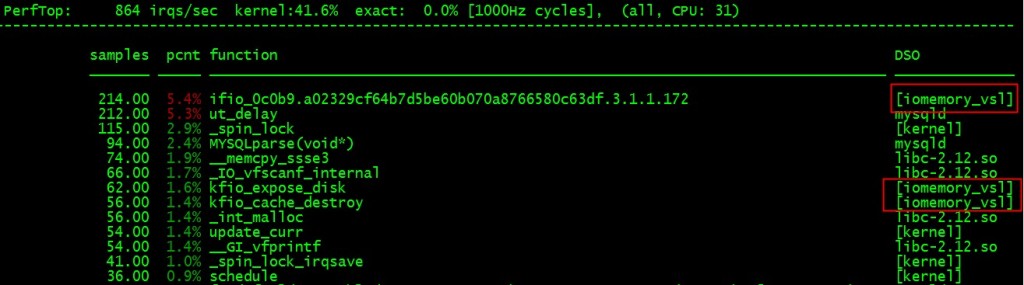
再cat /proc/interrupts看下实践效果就可以看到后面的核心已经有中断了,而且0号核心上的数字没变!
# perf top –cpu=31
也验证了这一点:
另外一姐妹篇 “MYSQL数据库网卡软中断不平衡问题及解决方案” 参见 这里!
祝玩的开心!
今天曲山同学在线上问道:
我测试发现,如果cp一个文件,然后direct io读这个文件,会消耗很长时间。
我猜测dio不能用page cache,而这个文件cp以后都在cache里面,要强制刷到磁盘,才能读?
我cp这个文件很大,超过256M
由于数据文件默认是用bufferedio方式打开的,也就是说它的数据是先缓冲在pagecache里面的,写入的数据会导致大量的脏页,而且这部分数据如果内核内存不紧张的话,是一直放在内存里面的的。我们知道directio是直接旁路掉pagecache直接发起设备IO的,也就是说在发起IO之前要保证数据是先落地到介质去,所以如果文件比较大的话,这个时间会比较长。从pagecahce的回写行为我们可以知道,只要脏页的数量不超过总内存的10%, 我们的机器有4G的内存,所以2个100M的文件总共才200M,不会导致writeback发生,我们可以很顺利的观察到这个现象。
有了上面的分析,下面我们来重现下这个问题。以下是我的步骤:
Read more…
今天在内核群里印风同学问了个问题:
某台机器的ulimit -t 不知道为啥是300, 这是不是意味着程序占用CPU 300秒后会收到SIGKILL ?
我用gdb跑mysqld 跑了一会,收到SIGKILL信号,没有配置cgroup,也没啥后台脚本,看了下,就ulimit -t 比较诡异,其他机器都是unlimited。
简单的man ulimit下手册说:
-t The maximum amount of cpu time in seconds
貌似限制的是CPU最大执行时间,以秒为单位。
为了验证上面的说法,我特地设计了以下的场景:我们首先运行一个死循环程序消耗CPU时间,同时把进程的最大CPU消耗时间设定在180秒,期待在这个时间点进程会被杀掉。
以下是验证过程:
$ uname -r
2.6.32-131.21.1.tb477.el6.x86_64
$ ulimit -t 180
$ ulimit -t
180
$ cat busy.c
int main(int argc, char *argv[]) {
  for(;;);
  return 0;
}
$ gcc busy.c
$ time ./a.out
Killed

real	3m0.029s
user	2m59.966s
sys	0m0.007s
从现象来看,3分钟后我们的busy进程确实被杀了,dmesg也没说什么原因被杀。
Read more…
今天4月份在高阳同学的IO协议栈相关的PPT里面发现了这张图,最终来源 http://www.thomas-krenn.com/en/oss/linux-io-stack-diagram/linux-io-stack-diagram_v0.1.pdf,忍不住还是贴了出来。

这张图很清晰的把linux IO协议栈的层次给勾出来了,而且内容很与时俱进,特别是SCSI设备的层次对大家理解sg3这样的包非常有帮助,强烈推荐大家好好研习!
祝玩得开心!
刚@淘宝雕梁 告诉我 GLIBC 2.16 支持systemtap静态检查点,消息源在这里, 摘抄相关部分如下:
* New configure option –enable-systemtap builds SystemTap static probes
into libc for setjmp and longjmp and into libpthread for various operations.
So far the setjmp/longjmp probes and some of the libpthread probes are
provided only for i*86 and x86_64.
Implemented by Roland McGrath and Rayson Ho.
目前主要是在setjmp/longjmp和pthread相关的锁操作,而且只支持 i*86 and x86_64 平台。我们到源码验证下:
Read more…
我们在做网络服务器的时候,通常会很关心网络的带宽和延迟。因为我们的很多协议都是request-reponse协议,延迟决定了最大的QPS,而带宽决定了最大的负荷。 通常我们知道自己的网卡是什么型号,交换机什么型号,主机之间的物理距离是多少,理论上是知道带宽和延迟是多少的。但是现实的情况是,真正的带宽和延迟情况会有很多变数的,比如说网卡驱动,交换机跳数,丢包率,协议栈配置,光实际速度都很大的影响了数值的估算。 所以我们需要找到工具来实际测量下。
网络测量的工具有很多,netperf什么的都很不错。 我这里推荐了qperf,这是RHEL 6发行版里面自带的,所以使用起来很方便,只要简单的:
yum install qperf
就好。
我们看下man qperf的介绍:
qperf measures bandwidth and latency between two nodes. It can work over TCP/IP as well as the RDMA transports. On one of the nodes, qperf is typically run with no arguments designating it the server node. One may then run qperf on a client node to obtain measurements such as bandwidth, latency and cpu utilization.
In its most basic form, qperf is run on one node in server mode by invoking it with no arguments. On the other node, it is run with two arguments: the name of the server node followed by the name of the test. A list of tests can be found in the section, TESTS. A variety of options may also be specified.
使用起来也相当简单: Read more…
Recent Comments