喝杯黑咖啡时间
命运垂青有准备之人
February 22nd, 2024
Comments off

刻在石头的文字:
“I WILL STUDY AND GET READY AND THEN MAYBE THE CHANCE WILL COME “
-ABRAHAM LINCOLN
Post Footer automatically generated by wp-posturl plugin for wordpress.
艺术需要天赋
February 22nd, 2024
Comments off
能归结于艺术的活大多需要天赋,上天gifted区别于普通人,通常有两个脑子,一个用来处理人间俗事,一个用来沉浸在喜欢的事情上靠直觉就能决定,有分离创造的专注不被打扰的能力,控制稀缺资源的投入,进入心流转态。
Post Footer automatically generated by wp-posturl plugin for wordpress.
算力提升思考
February 21st, 2024
Comments off
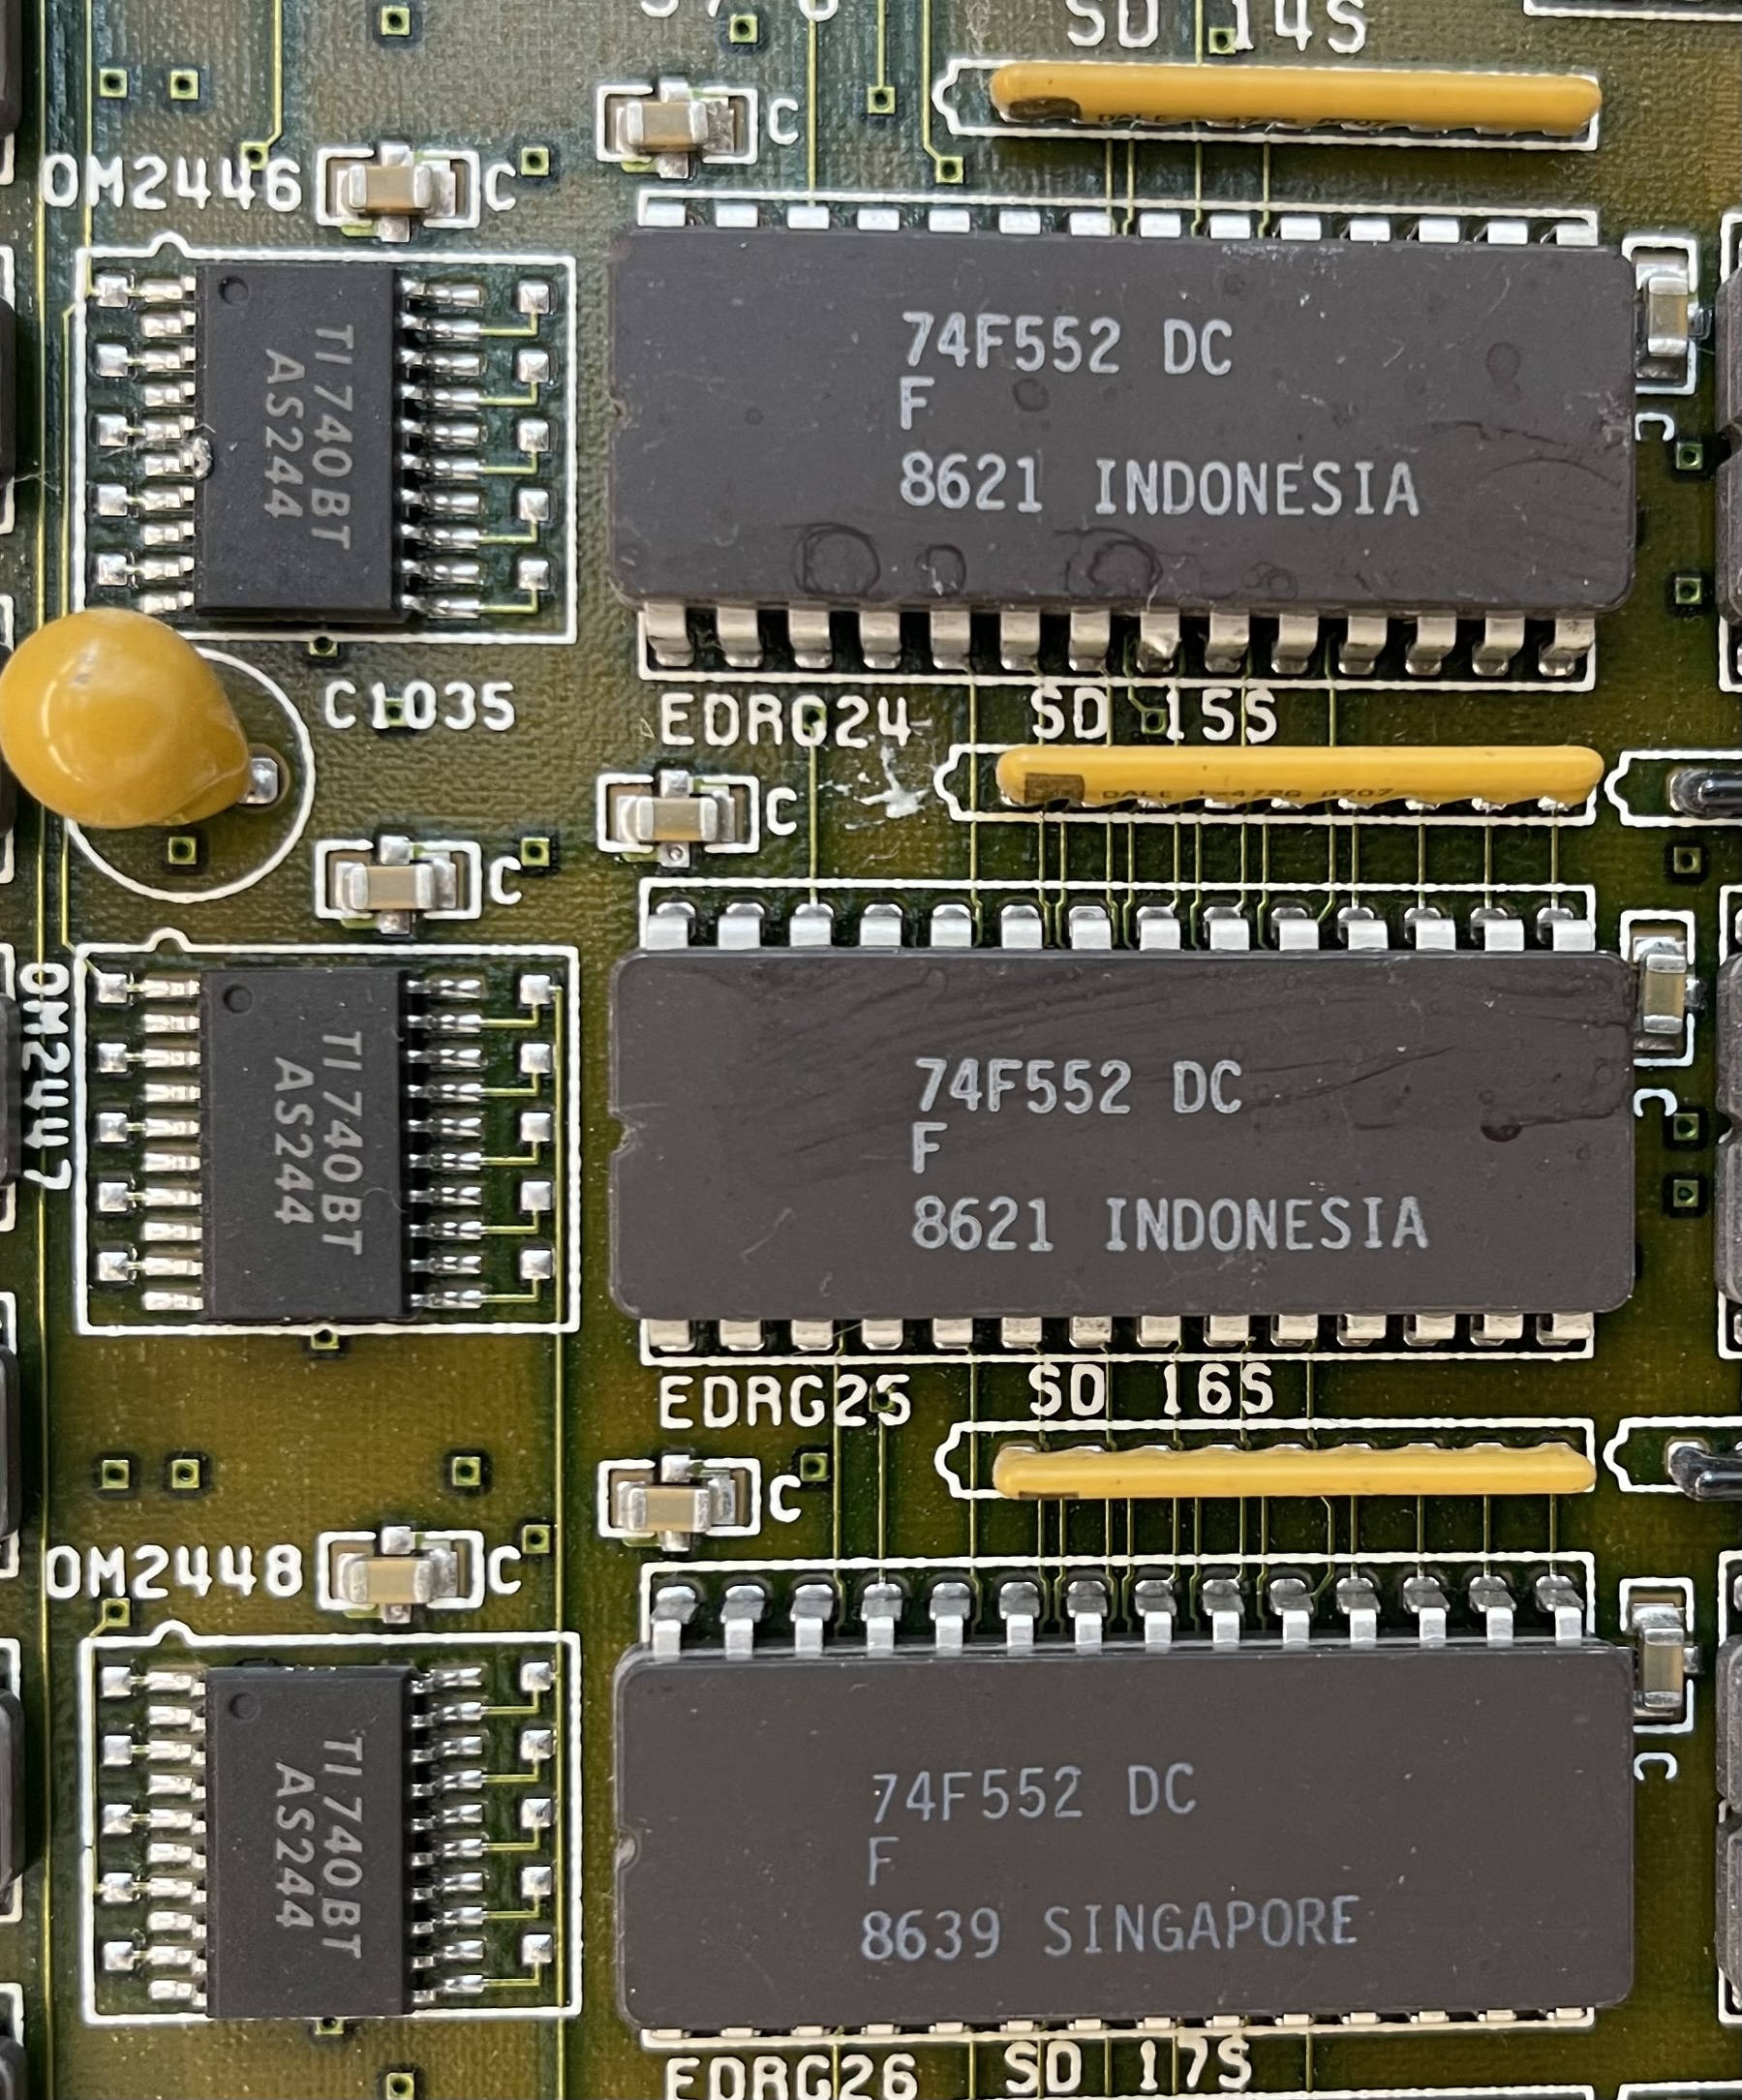
芯片算力=晶体管密度*芯片面积*算力/晶体管
算力提升对应着先进工艺、光刻机、计算架构的突破,三者背后对应着资本和智力的密度。
制程和光刻机被锁死,个人判断2030年国内供应链不大可能有大的突破,剩下的路子只有提高单位晶体管的算力的这个优化路子。
可以解读为计算架构的优化,也就是软件来定义硬件,而不是反过来由软件来适配硬件。
Post Footer automatically generated by wp-posturl plugin for wordpress.
Categories: Erlang探索
论产品设计的重要性从一粒胶卷包装皮说起
February 20th, 2024
Comments off
原创文章,转载请注明: 转载自系统技术非业余研究
本文链接地址: 论产品设计的重要性从一粒胶卷包装皮说起
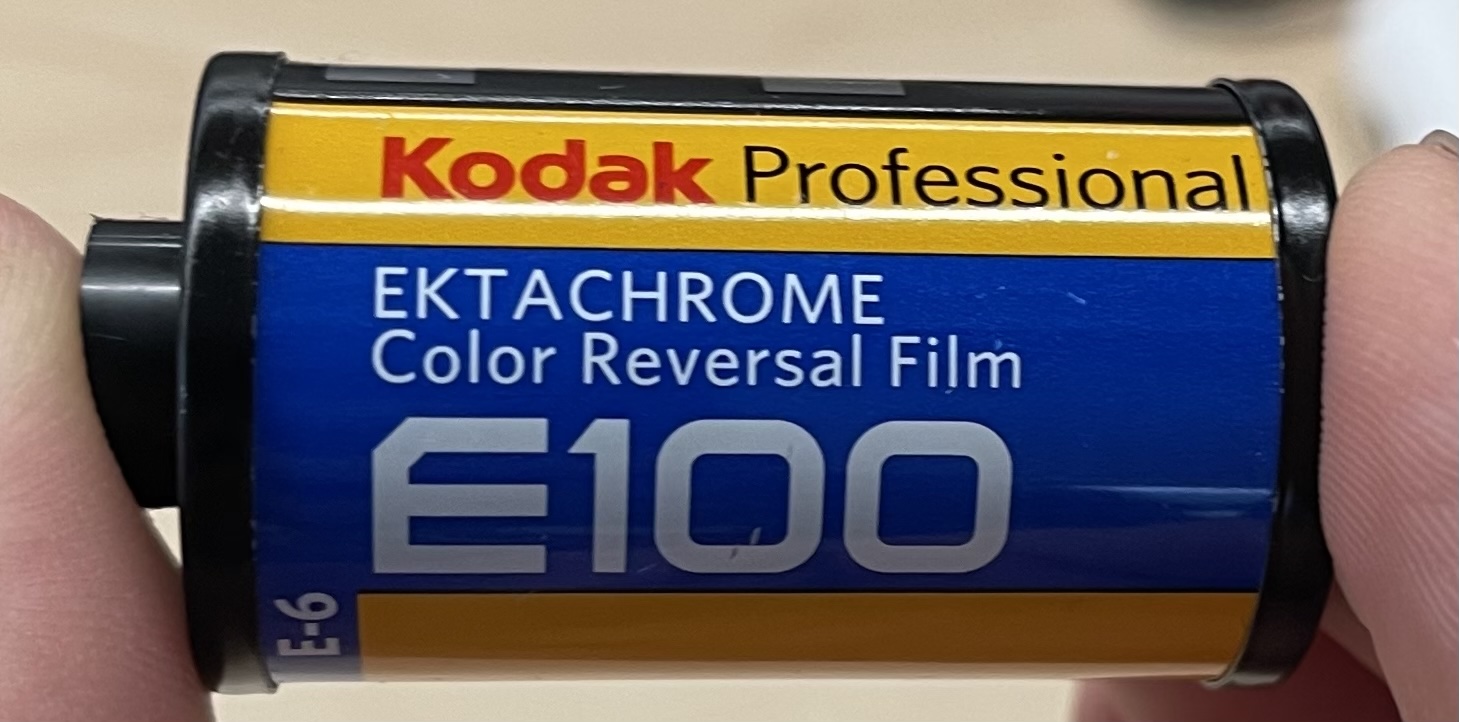
论产品设计的重要性,一粒胶卷包装皮向四种用户表达重要信息:
1. 摄影师:卷类型(彩色正片), ISO(100),张数(36),感光色温(日光卷),记录拍摄Notes(马克笔)
2. 冲洗师:冲洗工艺(E6)
3. 傻瓜相机:ISO光电码(12黑白格),胶卷装载透明盒(E100.36)
4. 销售Pos机:条形码, 序列号(903824)
Koda E100胶卷是个很好的产品使用说明典范,表达的信息清晰,辨识度高,审美在线。
很多习以为常的事情,我们以为文章本天成,实际上是精心设计的!
Post Footer automatically generated by wp-posturl plugin for wordpress.
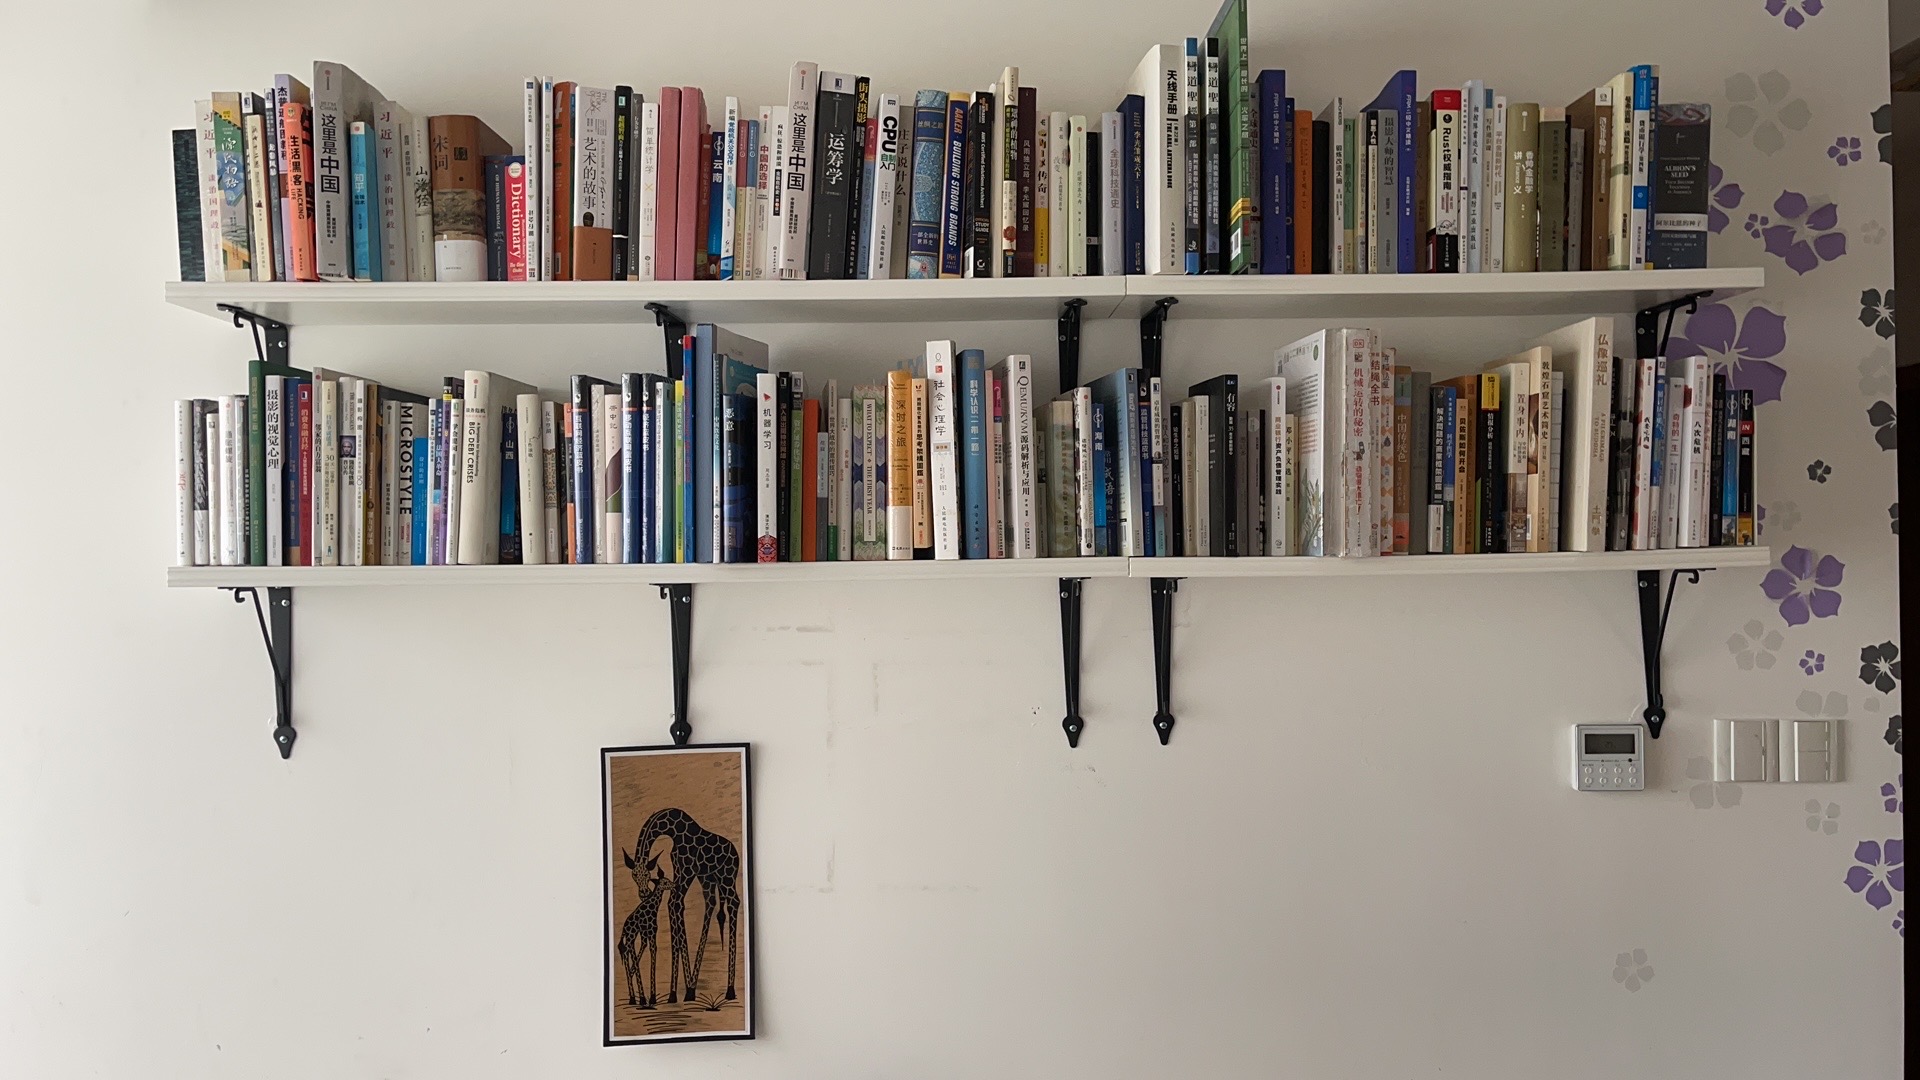
7年读了23米书
May 30th, 2023
Comments off
截止时间20230530,杭州
打算三年时间把大英百科全书读完。
240222 更新书堆又高了5米
Post Footer automatically generated by wp-posturl plugin for wordpress.
短波电台全频段天线
October 26th, 2022
Comments off
正V750天线立起来了!
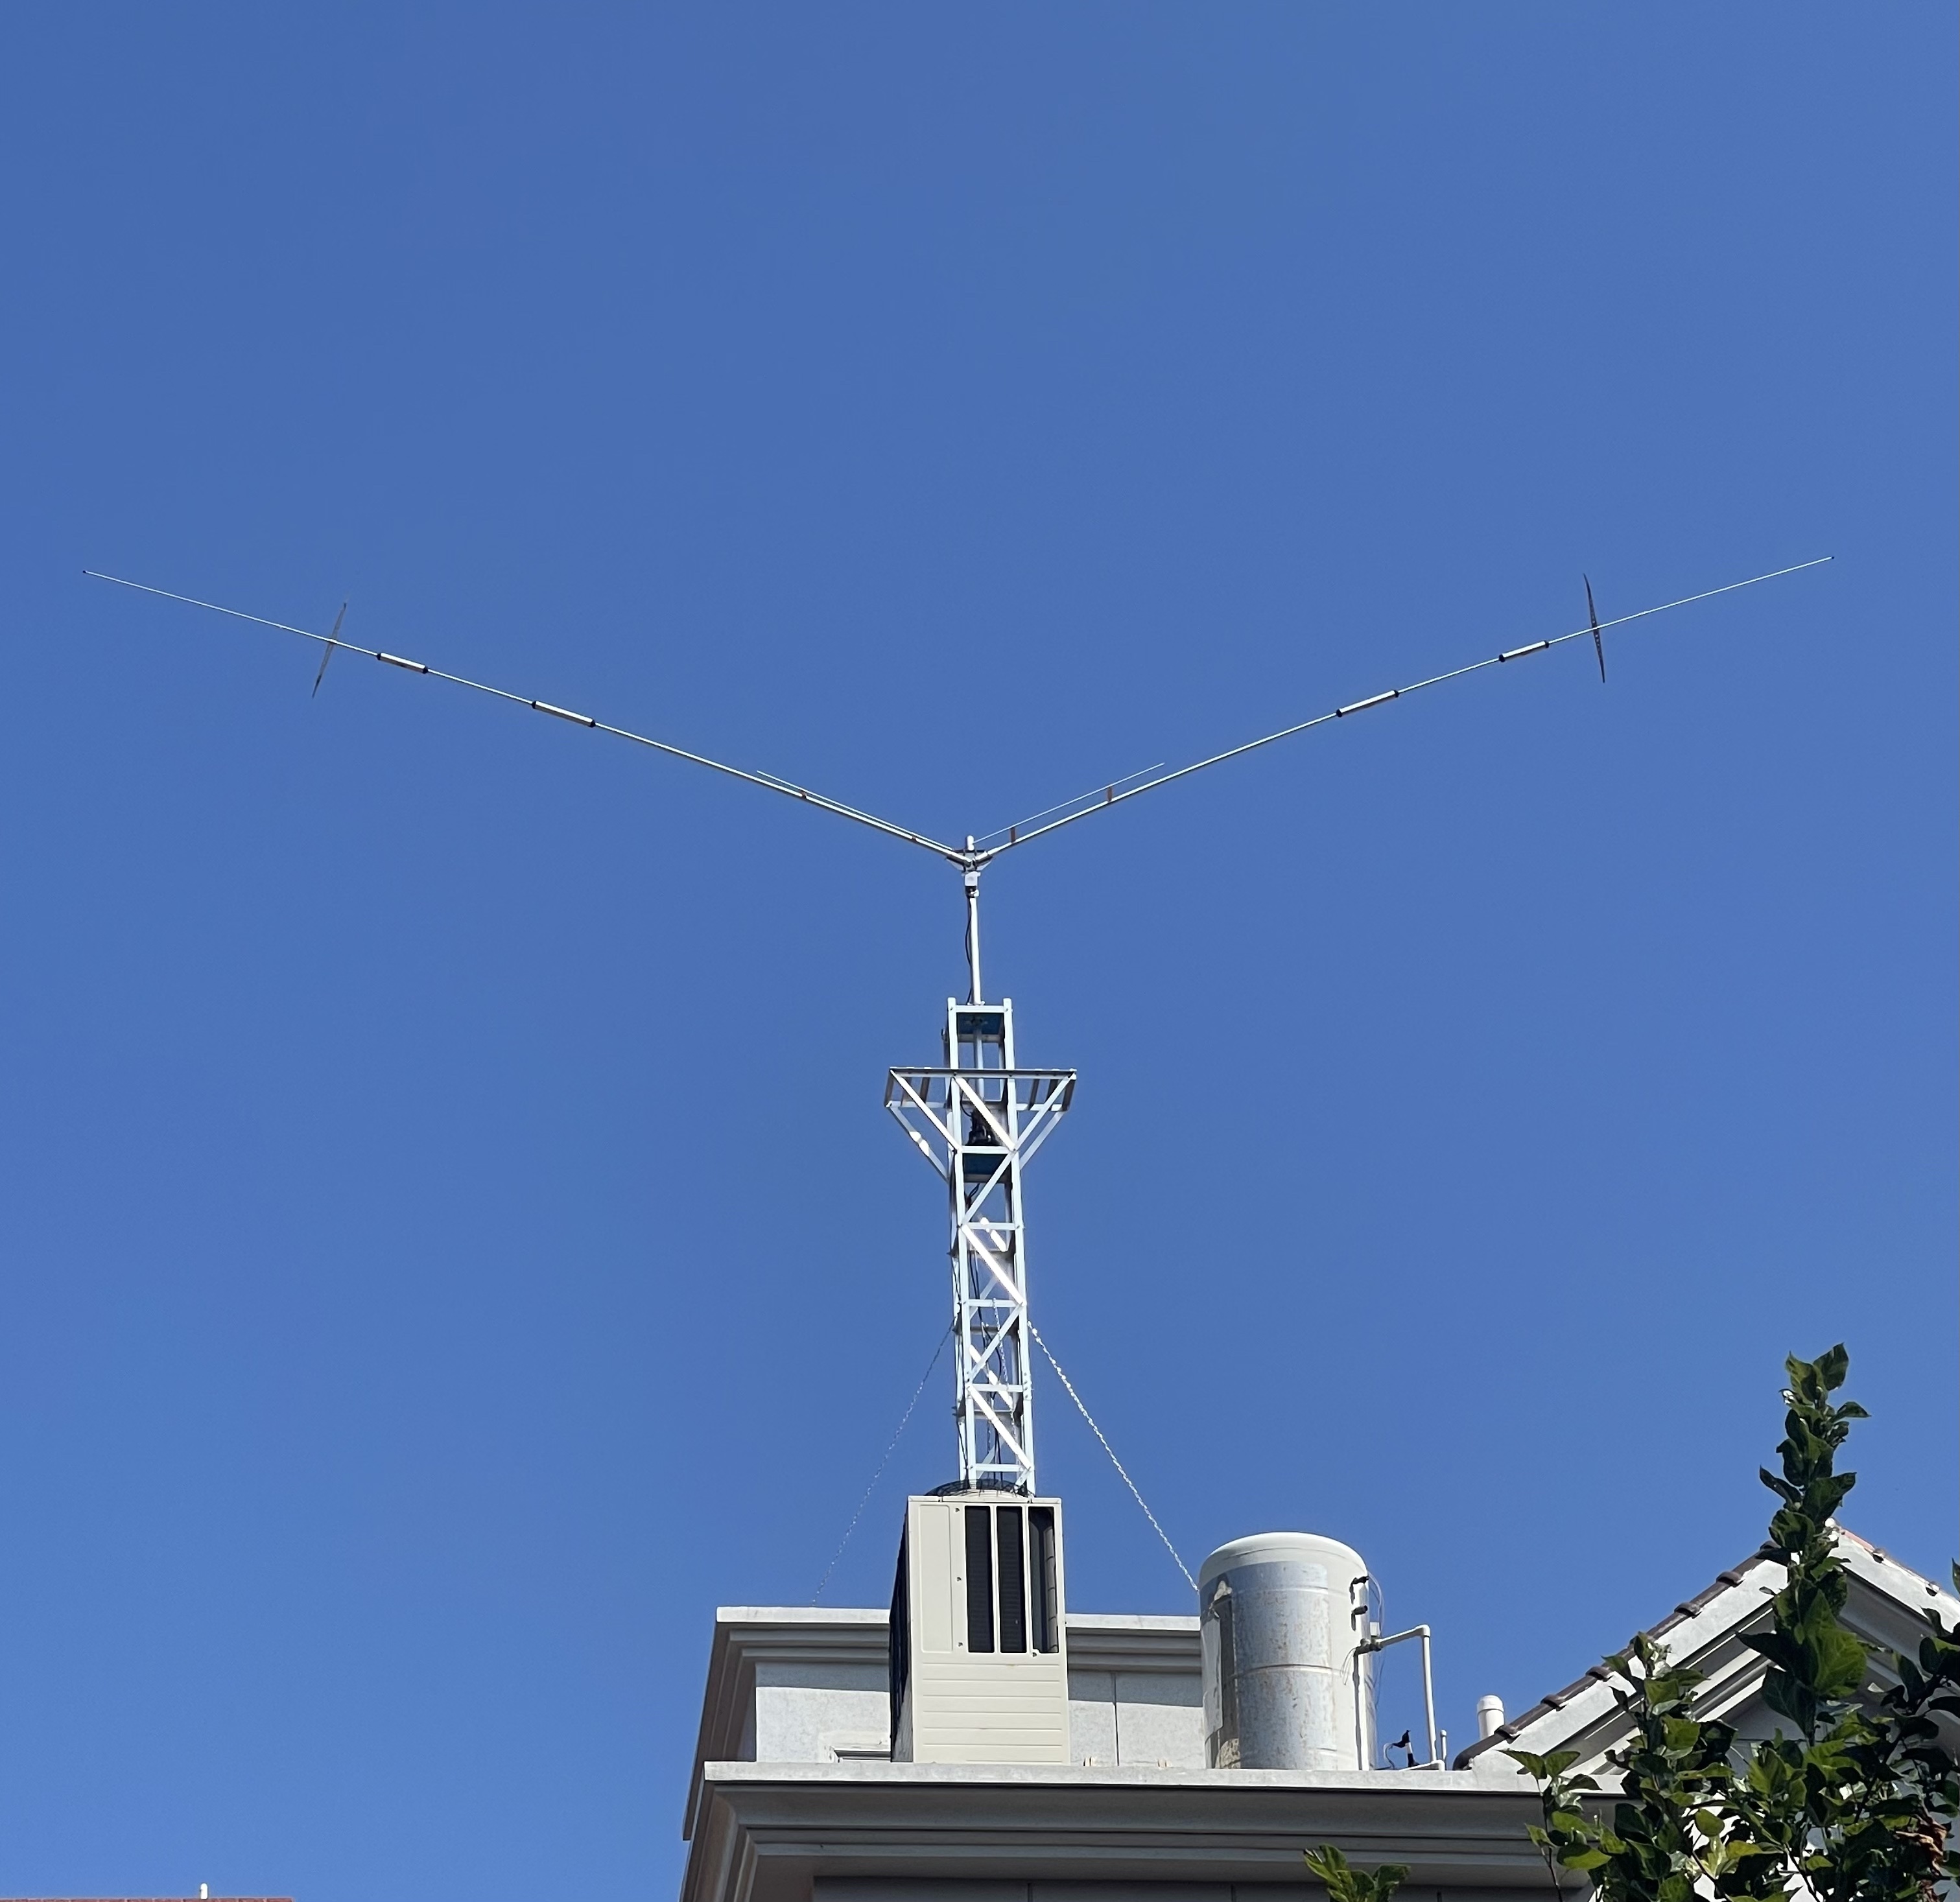
中心频点:
7mhz 7.050mhz
14mhz 14.180mhz
21mhz 21.2mhz
28/29mhz 29mhz
50mhz 50.150
Post Footer automatically generated by wp-posturl plugin for wordpress.
Categories: Erlang探索
近期状态更新
October 26th, 2022
Comments off
蚂蚁超级计算部负责人、蚂蚁基础设施技术委员会主席。主管蚂蚁基础软件产品和通智算力基础设施。
更新时间:20240222
Post Footer automatically generated by wp-posturl plugin for wordpress.
Categories: Erlang探索
Recent Comments