Archive

Author Archive

Erlang取当前时间的瓶颈以及解决方案

November 4th, 2013 4 comments

高性能网络服务器通常会涉及大量和时间相关的场景和操作,比如定时器,读取事件的发生时间,日志等等。

erlang提供了二种方式来获取时间:
1. erlang:now()
2. os:timestamp()
获取取到时间后,我们通常用calendar:now_to_universal_time来格式化类似”{{2013,11,4},{8,46,20}}”这样人可读的时间。

由于时间调用非常的频繁,而且通常发生在关键路径上,所以效率和性能就非常值得深挖了。

我们先来看下这二个函数的说明:
erlang:now 参看这里

now() -> Timestamp

Types:

Timestamp = timestamp()
timestamp() =
{MegaSecs :: integer() >= 0,
Secs :: integer() >= 0,
MicroSecs :: integer() >= 0}
Returns the tuple {MegaSecs, Secs, MicroSecs} which is the elapsed time since 00:00 GMT, January 1, 1970 (zero hour) on the assumption that the underlying OS supports this. Otherwise, some other point in time is chosen. It is also guaranteed that subsequent calls to this BIF returns continuously increasing values. Hence, the return value from now() can be used to generate unique time-stamps, and if it is called in a tight loop on a fast machine the time of the node can become skewed.

It can only be used to check the local time of day if the time-zone info of the underlying operating system is properly configured.

If you do not need the return value to be unique and monotonically increasing, use os:timestamp/0 instead to avoid some overhead.

os:timestamp 参看这里

timestamp() -> Timestamp

Types:

Timestamp = erlang:timestamp()
Timestamp = {MegaSecs, Secs, MicroSecs}
Returns a tuple in the same format as erlang:now/0. The difference is that this function returns what the operating system thinks (a.k.a. the wall clock time) without any attempts at time correction. The result of two different calls to this function is not guaranteed to be different.

The most obvious use for this function is logging. The tuple can be used together with the function calendar:now_to_universal_time/1 or calendar:now_to_local_time/1 to get calendar time. Using the calendar time together with the MicroSecs part of the return tuple from this function allows you to log timestamps in high resolution and consistent with the time in the rest of the operating system.

但是事情没这么简单!

由于erlang支持时间纠正机制,简单的说在时间发生突变的时候,还能维持正常的时间逻辑,具体的实现参看这篇:服务器时间校正思考。

时间纠正机制让事情变得复杂,这个时间纠正机制如何禁止呢:

+c
Disable compensation for sudden changes of system time.

Normally, erlang:now/0 will not immediately reflect sudden changes in the system time, in order to keep timers (including receive-after) working. Instead, the time maintained by erlang:now/0 is slowly adjusted towards the new system time. (Slowly means in one percent adjustments; if the time is off by one minute, the time will be adjusted in 100 minutes.)

When the +c option is given, this slow adjustment will not take place. Instead erlang:now/0 will always reflect the current system time. Note that timers are based on erlang:now/0. If the system time jumps, timers then time out at the wrong time.

正是由于时间纠正机制的存在,所以服务器需要不时的修正时间,同一时刻可能还有很多线程在读取时间,为了维护时间的一致性,需要有个锁来保护。
我们来看下相关的代码实现:
Read more…

inet驱动新增加{active,N} socket选项

November 3rd, 2013 5 comments

Erlang实现的网络服务器性能是非常高的,一个典型的服务器比如proxy我们可以处理40万个包的进出,链接数在万级别的。当然这么高的网络能力和底层的epoll实现有很大关系。那么通常我们的gen_tcp收到内核协议栈过来完整的封包的时候,有三种方式可以通知到我们,参见inet:setopts文档

{active, true | false | once}
If the value is true, which is the default, everything received from the socket will be sent as messages to the receiving process. If the value is false (passive mode), the process must explicitly receive incoming data by calling gen_tcp:recv/2,3 or gen_udp:recv/2,3 (depending on the type of socket).

If the value is once ({active, once}), one data message from the socket will be sent to the process. To receive one more message, setopts/2 must be called again with the {active, once} option.

When using {active, once}, the socket changes behaviour automatically when data is received. This can sometimes be confusing in combination with connection oriented sockets (i.e. gen_tcp) as a socket with {active, false} behaviour reports closing differently than a socket with {active, true} behaviour. To make programming easier, a socket where the peer closed and this was detected while in {active, false} mode, will still generate the message {tcp_closed,Socket} when set to {active, once} or {active, true} mode. It is therefore safe to assume that the message {tcp_closed,Socket}, possibly followed by socket port termination (depending on the exit_on_close option) will eventually appear when a socket changes back and forth between {active, true} and {active, false} mode. However, when peer closing is detected is all up to the underlying TCP/IP stack and protocol.

Note that {active,true} mode provides no flow control; a fast sender could easily overflow the receiver with incoming messages. Use active mode only if your high-level protocol provides its own flow control (for instance, acknowledging received messages) or the amount of data exchanged is small. {active,false} mode or use of the {active, once} mode provides flow control; the other side will not be able send faster than the receiver can read.

效率最高的当然是{active, true}方式,因为这种实现一个链接只一次epoll_ctl把socket的读事件挂上去,但是这种方式有致命的缺点。因为收到的包是通过消息的方式来通知我们的,完全是异步的。在正常情况下,没啥问题,但是如果我们的服务面对互联网就有很大的风险,如果遭受攻击的时候,对端发送大量的数据包的时候,我们的系统就会异步收到大量的消息,可能会超过我们的进程处理能力。最要命的是,我们无法让包停止下来,最后的结局就是我们的服务器因为缺少内存crash了。所以在实践中,我们都会用{active,once}方式来控制包的接收频率,这样避免了安全的问题,但是带来了性能的问题。每次设定{active,once}都意味着调用一次epoll_ctl。 如果strace我们的程序会发现有大量的epoll_ctl调用,基本上每秒达到QPS的数量。还有个问题也加剧了这个性能退化:erlang只有一个线程会收割epoll_wait事件,如果大量的ctl时间阻塞了事件的收割,网络处理的能力会大大下降。未来的版本官方计划会支持多个线程收割,但是现在还不行。

所以现在问题就来了,性能和安全如何平衡。Erlang出手拯救我们了,见这里

inet driver add {active,N} socket option for TCP, UDP, and SCTP

这个功能在版本R16b03可用。

解决问题的思路很简单:
{active, true}有安全问题, {active, once}太慢, {active,N}我们一次设定来收N个消息包,摊薄epoll_ctl的代价,这样就可以大大缓解性能的压力。
Read more…

Erlang调度器的利用率调查

November 3rd, 2013 6 comments

Erlang的调度器效率非常高,大概在128核的情况下有80%的利用率,即使是这样,由于CPU和内存体系的结构的限制,调度器的实现还是有大量的锁存在。erts的实现为了避免core scale的问题,通常不会采用锁在那里傻等,而是采用更乐观的无锁算法,这样会有不少的CPU空转现象。

那么如何评估调度器的效率呢?我们可以从系统层面,比如从top看,每个调度器线程忙不忙。但是这只是表象,调度器可能在空转等锁,最靠谱的应该是把调度器真正干活的时间累计起来,比较真实的反应它的效率。

erlang从R15以后提供了调度器的利用率调查,这个函数就是:erlang:statistics(scheduler_wall_time) 。

我们来看下它的文档:

statistics(Item :: scheduler_wall_time) ->
[{SchedulerId, ActiveTime, TotalTime}] | undefined

Types:

SchedulerId = integer() >= 1
ActiveTime = TotalTime = integer() >= 0

Returns a list of tuples with {SchedulerId, ActiveTime, TotalTime}, where SchedulerId is an integer id of the scheduler, ActiveTime is the duration the scheduler has been busy, TotalTime is the total time duration since scheduler_wall_time activation. The time unit is not defined and may be subject to change between releases, operating systems and system restarts. scheduler_wall_time should only be used to calculate relative values for scheduler-utilization. ActiveTime can never exceed TotalTime.

The definition of a busy scheduler is when it is not idle or not scheduling (selecting) a process or port, meaning; executing process code, executing linked-in-driver or NIF code, executing built-in-functions or any other runtime handling, garbage collecting or handling any other memory management. Note, a scheduler may also be busy even if the operating system has scheduled out the scheduler thread.

Returns undefined if the system flag scheduler_wall_time is turned off.

The list of scheduler information is unsorted and may appear in different order between calls.

Using scheduler_wall_time to calculate scheduler utilization.

> erlang:system_flag(scheduler_wall_time, true).
false
> Ts0 = lists:sort(erlang:statistics(scheduler_wall_time)), ok.
ok
Some time later we will take another snapshot and calculate scheduler-utilization per scheduler.

> Ts1 = lists:sort(erlang:statistics(scheduler_wall_time)), ok.
ok
> lists:map(fun({{I, A0, T0}, {I, A1, T1}}) ->
{I, (A1 – A0)/(T1 – T0)} end, lists:zip(Ts0,Ts1)).
[{1,0.9743474730177548},
{2,0.9744843782751444},
{3,0.9995902361669045},
{4,0.9738012596572161},
{5,0.9717956667018103},
{6,0.9739235846420741},
{7,0.973237033077876},
{8,0.9741297293248656}]
Using the same snapshots to calculate a total scheduler-utilization.

> {A, T} = lists:foldl(fun({{_, A0, T0}, {_, A1, T1}}, {Ai,Ti}) ->
{Ai + (A1 – A0), Ti + (T1 – T0)} end, {0, 0}, lists:zip(Ts0,Ts1)), A/T.
0.9769136803764825

其中要注意的是”scheduler_wall_time is by default disabled. Use erlang:system_flag(scheduler_wall_time, true) to enable it.”。原因是运行期需要去做统计工作会影响性能。而且函数返回的每个调度器的使用情况顺序是乱的,需要排序下。

percept2提供了个percept2_sampling来帮我们可视化这个利用率, 演示如下:

我们启动percept2_sampling收集系统一分钟的数据,然后用web界面查看:

$ erl -pa percept2/ebin
Erlang R15B03 (erts-5.9.3.1) [source] [64-bit] [smp:16:16] [async-threads:0] [hipe] [kernel-poll:false]

Eshell V5.9.3.1  (abort with ^G)
1> percept2:start_webserver(8933).
{started,"rds064076",8933}
2> percept2_sampling:start([all], 60000, ".").
<0.57.0>

它的操作界面如下:
Percept2_sampling

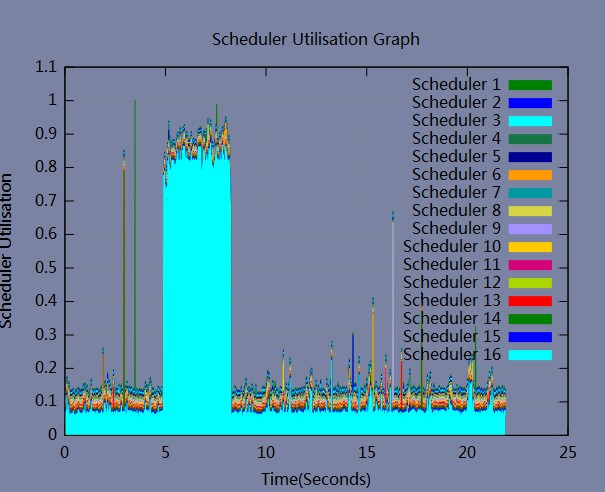
调度器的利用率效果如图:
sug

我们可以看到3号调度器比较忙,其他的都闲的。

祝玩得开心!

R16B03新增加super carrier来减少mmap的系统调用

November 3rd, 2013 Comments off

Erlang内存分配的框架一句话总结,从erts_alloc文档摘抄如下:

erts_alloc is an Erlang Run-Time System internal memory allocator library. erts_alloc provides the Erlang Run-Time System with a number of memory allocators.

可见Erlang的内存分配体系是非常复杂的,有很深的层次,erts内部开发人员面对的是erts_alloc来提供服务,比如分配port相关的数据结构代码如下:

pdhp = erts_alloc(ERTS_ALC_T_PORT_DATA_HEAP,
sizeof(ErtsPortDataHeap) + hsize*(sizeof(Eterm)-1));

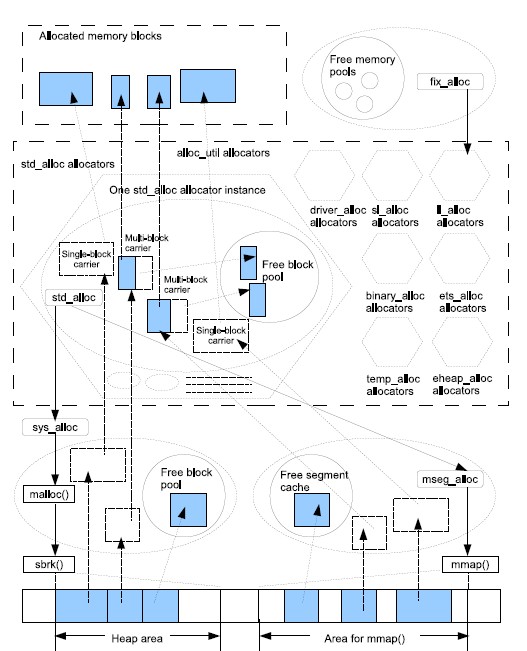
使用起来非常简单。但是Erlang系统是个靠消息传递的语言,每个消息传递都需要分配内存,在自动Gc的时候需要释放内存,在典型的服务器上比如proxy, 每天单binary数据类型的分配和释放达到1亿次之多,所以内存分配器的效率就显的特别的重要。 所以erlang采用了一套非常庞杂的内存分配系统来满足这种需求,见下图:

erlang_memory_overview

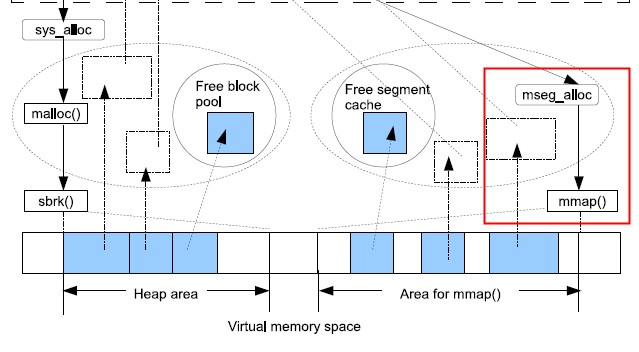
粗粗的讲,内存分配器从sys_alloc和mseg_alloc批发内存,然后再零售给终端用户。其中sys_alloc就是libc的malloc, mseg_alloc就是mmap, 通过这二个接口从操作系统大批量申请内存,我们把上图的相关部分放大下看:

erlang_memory_mmap

我们今天要讲的就是红框的那部分,erlang系统偏向于从mmap申请内存,因为过程比libc或者tcmalloc比较可控。所以如果Erlang的应用内存使用非常密集和需求变化很大的时候,就需要经常从操作系统那里批发和归还内存。而批发通常是通过mmap来的,这就是为什么我们strace beam的时候,进程会发现有很多mmap系统调用。

我们知道mmap系统调用是要进入内核再出来的。内核在内核空间维护了一颗树(比如红黑树)来管理虚拟内存。当系统调用次数非常多的时候,开销就出来了。既然mmap是用树在内核空间,那为什么我们不能在erlang内存分配器里面自己来维护呢?这样算法是一样的,但是减少了进出内核的开销。基于这个思路,最近rickard-sverker同学为Erlang R16B03添加了supercarrier, 具体参见这里

这个super carrier的原理就是通过一次向内核申请大量的内存自己管理,进一步减少mmap的调用次数,虽然mseg_alloc已经做了简单的段cache有点效果了.

我们来看下supercarrier的使用文档:

+MMscmgc
Set super carrier max guaranteed no of carriers. This parameter defaults to 65536. This parameter determines an amount of pre-allocated structures that is needed in order to keep track of different areas in the super carrier. When the system runs out of such structures it may crash due to an out of memory condition.
+MMsco true|false
Set super carrier only flag. This flag defaults to true. When a super carrier is used and this flag is true, the system will crash when a carrier request cannot be satisfied by the super carrier. When the flag is false the system will try to create requested carrier by other means.

NOTE: Setting this flag to false may not be supported on all systems. This flag will in that case be ignored.

NOTE: The super carrier cannot be enabled nor disabled on halfword heap systems. This flag will be ignored on halfword heap systems.
+MMscrpm true|false
Set super carrier reserve physical memory flag. This flag defaults to true. When this flag is true, physical memory will be reserved for the whole super carrier at once when it is created. The reservation will after that be left unchanged. When this flag is set to false only virtual address space will be reserved for the super carrier upon creation. The system will attempt to reserve physical memory upon carrier creations in the super carrier, and attempt to unreserve physical memory upon carrier destructions in the super carrier.

NOTE: What reservation of physical memory actually means highly depends on the operating system, and how it is configured. For example, different memory overcommit settings on Linux drastically change the behaviour. Also note, setting this flag to false may not be supported on all systems. This flag will in that case be ignored.

NOTE: The super carrier cannot be enabled nor disabled on halfword heap systems. This flag will be ignored on halfword heap systems.
+MMscs
Set super carrier size (in MB). The super carrier size defaults to zero; i.e, the super carrier is by default disabled. The super carrier is a large continuous area in the virtual address space. The system will always try to create new carriers in the super carrier.

NOTE: The super carrier cannot be enabled nor disabled on halfword heap systems. This flag will be ignored on halfword heap systems.

关键参数有二个:MMscs控制一次向内核申请的内存的总量,MMscrpm控制申请的内存要不要马上兑现(马上分配物理内存)。

我们来演示下supercarrier的使用,我们一次性给到erts 16G内存,用到的beam版本是2013/11/02号github上的erlang/otp master分支:
Read more…

R16B03提供long_schedule监控阻塞调度器的行为

October 30th, 2013 Comments off

Erlang很关键的一个能力就是软实时,可以显著提高应用的QOS。为什么可以做到软实时呢?参看这篇译文。这里面有二个东西没处理好会破坏erlang的公平调度机制:
1. BIF,靠trap机制来让出执行。
2. NIF,靠减少reductions来让出执行。

这二个机制都运行用户自己写的c代码来扩展erlang vm的功能。这些代码是跑在虚拟机的调度线程里头的,一旦每次处理太多东西,或者死锁什么的,会阻塞调度器,导致VM挂起,问题还是比较严重的。

erlang在最新的R16B03的版本中,很贴心的提供了long_schedule监控,让用户来提前发现这个问题并且解决这个问题。我摘抄下long_schedule的描述:

erlang:system_monitor(Arg) -> MonSettings

{long_schedule, Time}
If a process or port in the system runs uninterrupted for at least Time wall clock milliseconds, a message {monitor, PidOrPort, long_schedule, Info} is sent to MonitorPid. PidOrPort is the process or port that was running and Info is a list of two-element tuples describing the event. In case of a pid(), the tuples {timeout, Millis}, {in, Location} and {out, Location} will be present, where Location is either an MFA ({Module, Function, Arity}) describing the function where the process was scheduled in/out, or the atom undefined. In case of a port(), the tuples {timeout, Millis} and {port_op,Op} will be present. Op will be one of proc_sig, timeout, input, output, event or dist_cmd, depending on which driver callback was executing. proc_sig is an internal operation and should never appear, while the others represent the corresponding driver callbacks timeout, ready_input, ready_output, event and finally outputv (when the port is used by distribution). The Millis value in the timeout tuple will tell you the actual uninterrupted execution time of the process or port, which will always be >= the Time value supplied when starting the trace. New tuples may be added to the Info list in the future, and the order of the tuples in the list may be changed at any time without prior notice.

This can be used to detect problems with NIF’s or drivers that take too long to execute. Generally, 1 ms is considered a good maximum time for a driver callback or a NIF. However, a time sharing system should usually consider everything below 100 ms as “possible” and fairly “normal”. Schedule times above that might however indicate swapping or a NIF/driver that is misbehaving. Misbehaving NIF’s and drivers could cause bad resource utilization and bad overall performance of the system.

github上的提交参看这里,里面的testcase很好的演示了这点。

小结:system monitor能发现好多vm 潜在的问题,需要多挖掘。

祝玩得开心!

巧用Systemtap注入延迟模拟IO设备抖动

October 28th, 2013 4 comments

当我们的IO密集型的应用怀疑设备的IO抖动,比如说一段时间的wait时间过长导致性能或其他疑难问题的时候,这个现象处理起来就比较棘手,因为硬件的抖动有偶发性很难重现或者重现的代价比较高。

幸运的是systemtap可以拯救我们。从原理上讲,我们应用的IO都是通过文件系统来访问的,不管read/write/sync都是,而且我们的文件大部分都是以buffered方式打开的。在这个模式下,如果pagecache不命中的话,就需要访问设备。 知道了这个基本的原理以后,我们就可以用万能的systemtap往vfs的读写请求中受控的注入延迟,来达到这个目的。

要点有以下几个:
1. 受控的时间点。
2. 延迟时间可控。
3. 目标设备可控。

我写了个脚本注入IO延迟,模拟ssd/fio硬件的抖动来验证是否是IO抖动会给应用造成影响,三个步骤如下:
步骤1: 编译模块

$ cat inject_ka.stp
global inject, ka_cnt

probe procfs("cnt").read {
  $value = sprintf("%d\n", ka_cnt);
}
probe procfs("inject").write {
  inject= $value;
  printf("inject count %d, ka %s", ka_cnt, inject);
}

probe vfs.read.return,
      vfs.write.return {
  if ($return &&
      devname == @1 &&
      inject == "on\n")
  {
    ka_cnt++;
    udelay($2);
  }
}

probe begin{
  println("ik module begin:)");
}

$ stap -V
Systemtap translator/driver (version 2.1/0.152, commit release-2.0-385-gab733d5)
Copyright (C) 2005-2013 Red Hat, Inc. and others
This is free software; see the source for copying conditions.
enabled features: LIBSQLITE3 NSS BOOST_SHARED_PTR TR1_UNORDERED_MAP NLS

$ sudo stap -p4 -DMAXSKIPPED=9999 -m ik -g inject_ka.stp sda6 300
ik.ko

其中参数sda6是目标设备的名字,300是希望延迟的时间,单位us(超过300很容易报错,因为通常systemtap会对脚本执行的cpu进行检查,占用过多cpu的时候会触发保护机制,导致stap抱怨退出),通常对于ssd设备是足够的。

这个步骤会生成ik.ko,请验证生成模块的机器和目标的机器,操作系统的版本是一模一样的,而且请确保你的stap版本比较高,因为udelay函数在高版本的Stap才有。

步骤2:

将ik.ko拷贝到目标机器,执行

$ sudo staprun ik.ko
ik module begin:)

步骤3:
启动应用程序开始测试后一段时间,运行如下命令开始注入:

$ echo on|sudo tee /proc/systemtap/ik/inject  && sleep 10 && echo off|sudo tee /proc/systemtap/ik/inject

其中sleep N 是希望打开注入开关的时间。

小结:systemtap用好很无敌!

祝玩得开心!

Categories: Linux, 工具介绍 Tags:

R16B port并行机制详解

October 20th, 2013 Comments off

R16B发布的时候,其中一个很大的亮点就是R16B port并行机制, 摘抄官方的release note如下:

— Latency of signals sent from processes to ports — Signals
from processes to ports where previously always delivered
immediately. This kept latency for such communication to a
minimum, but it could cause lock contention which was very
expensive for the system as a whole. In order to keep this
latency low also in the future, most signals from processes
to ports are by default still delivered immediately as long
as no conflicts occur. Such conflicts include not being able
to acquire the port lock, but also include other conflicts.
When a conflict occur, the signal will be scheduled for
delivery at a later time. A scheduled signal delivery may
cause a higher latency for this specific communication, but
improves the overall performance of the system since it
reduce lock contention between schedulers. The default
behavior of only scheduling delivery of these signals on
conflict can be changed by passing the +spp command line flag
to erl(1). The behavior can also be changed on port basis
using the parallelism option of the open_port/2 BIF.

而且Jeff Martin同学也在qcon上发表了一篇文章特地提到这个事情,英文版见这里,中文版见这里

那么到底什么是R16B port并行机制呢?简单的说就是erl的这个选项:

+spp Bool
Set default scheduler hint for port parallelism. If set to true, the VM will schedule port tasks when it by this can improve the parallelism in the system. If set to false, the VM will try to perform port tasks immediately and by this improve latency at the expense of parallelism. If this flag has not been passed, the default scheduler hint for port parallelism is currently false. The default used can be inspected in runtime by calling erlang:system_info(port_parallelism). The default can be overriden on port creation by passing the parallelism option to open_port/2

作用呢?我们知道每个port都会有个锁来保证送给port的消息的先来后到,当有多个进程给port发送消息的话,必然要排队等前面的消息处理完毕。这是比较正常的行为。但是Erlang设计的哲学就是消息和异步通信,进程好好的时间浪费在排队上面总是不太爽。所以就搞了个port并行机制. 当进程发现需要排队的时候,他就把消息扔给port调度器,他自己就该干啥干啥去了,反正消息是异步的,他相信port调度器会把消息投递到。port调度器拿到用户委托的消息后,择机调度请求port去完成具体的任务。

类比下现实生活的例子。 比如说我去邮局寄快递,比如顺风快递,我寄了后,他会给我一个邮单号码,时候顺风会通知我邮包的情况,当然我也可以用这个邮单号码主动去查询状态。我到邮局一看,顺风快递的柜台只有一个工作人员在忙,而且寄东西人的队伍比较排很长了,这时候我有二个选择: 1. 在队伍的后面排队。 2. 我请求邮局的工作人员(比如保安)(当然可以给点小费)把我的邮包先收下,在寄东西人少的时候帮我寄下,而我就可以走了。 虽然我多花钱了,但是我花在上面的时间少了,这个小费可以挣的回来的。

port并行机制也是类似的原理。启用这个机制有二种方法:
1. 全局的。erl +spp Bool
2. per port的。open_port(PortName, PortSettings)的时候打开{parallelism, true}选项。

但是任何事情都有二面性。打开这个选项后需要注意什么呢?

我们还是拿前面的寄快递的例子来看,如果每个人都象我这样的都把邮包委托给保安去寄的话,那人多的话会有什么情况呢?保安那边有成堆的邮件,他领导一看,肯定要生气了,所以保安肯定会限制邮包数目。超过了,他就不接了。所以这就是调度器的水位线。而且顺风快递工作人员也有水位线,不如全杭州的人都来寄邮件他受的了?

那这二个水位线分别是多少呢? 我之前写的这篇文章 gen_tcp发送缓冲区以及水位线问题分析 解释的很清楚,我简单的复述下:

1. port自己的水位线,比如说inet_tcp是:
#define INET_HIGH_WATERMARK (1024*8) /* 8k pending high => busy */
#define INET_LOW_WATERMARK (1024*4) /* 4k pending => allow more */

这个水位线可以透过inet:setopts选项来设置:
{low_watermark, Size}
{high_watermark, Size} (TCP/IP sockets)

2. MSGQ高低水位线也是8/4K,最小值是1, 高不封顶。当然也有选项可以设置。
{high_msgq_watermark, Size}
{low_msgq_watermark, Size}

这篇文章还解释了“A signal delivery”这个动作。每个port都要把消息发送出去处理了才有意义,那么这个发送动作其实就是call_driver_outputv, 调用port特有的driver_outputv回调函数去做实际的事情。说白了port并行机制就是控制什么时候调用call_driver_outputv, 从原来的直接调,改成如果条件不合适,就让port调度器线程择机来调用。

小结:通过port并行机制可以大大提高整个VM中大量port的吞吐量,对于port或者网络密集型(gen_tcp就是个port)的应用会有很大的帮助。

祝玩得开心!