Erlang调度器的利用率调查
原创文章,转载请注明: 转载自系统技术非业余研究
本文链接地址: Erlang调度器的利用率调查
Erlang的调度器效率非常高,大概在128核的情况下有80%的利用率,即使是这样,由于CPU和内存体系的结构的限制,调度器的实现还是有大量的锁存在。erts的实现为了避免core scale的问题,通常不会采用锁在那里傻等,而是采用更乐观的无锁算法,这样会有不少的CPU空转现象。
那么如何评估调度器的效率呢?我们可以从系统层面,比如从top看,每个调度器线程忙不忙。但是这只是表象,调度器可能在空转等锁,最靠谱的应该是把调度器真正干活的时间累计起来,比较真实的反应它的效率。
erlang从R15以后提供了调度器的利用率调查,这个函数就是:erlang:statistics(scheduler_wall_time) 。
我们来看下它的文档:
statistics(Item :: scheduler_wall_time) ->
[{SchedulerId, ActiveTime, TotalTime}] | undefinedTypes:
SchedulerId = integer() >= 1
ActiveTime = TotalTime = integer() >= 0Returns a list of tuples with {SchedulerId, ActiveTime, TotalTime}, where SchedulerId is an integer id of the scheduler, ActiveTime is the duration the scheduler has been busy, TotalTime is the total time duration since scheduler_wall_time activation. The time unit is not defined and may be subject to change between releases, operating systems and system restarts. scheduler_wall_time should only be used to calculate relative values for scheduler-utilization. ActiveTime can never exceed TotalTime.
The definition of a busy scheduler is when it is not idle or not scheduling (selecting) a process or port, meaning; executing process code, executing linked-in-driver or NIF code, executing built-in-functions or any other runtime handling, garbage collecting or handling any other memory management. Note, a scheduler may also be busy even if the operating system has scheduled out the scheduler thread.
Returns undefined if the system flag scheduler_wall_time is turned off.
The list of scheduler information is unsorted and may appear in different order between calls.
Using scheduler_wall_time to calculate scheduler utilization.
> erlang:system_flag(scheduler_wall_time, true).
false
> Ts0 = lists:sort(erlang:statistics(scheduler_wall_time)), ok.
ok
Some time later we will take another snapshot and calculate scheduler-utilization per scheduler.> Ts1 = lists:sort(erlang:statistics(scheduler_wall_time)), ok.
ok
> lists:map(fun({{I, A0, T0}, {I, A1, T1}}) ->
{I, (A1 – A0)/(T1 – T0)} end, lists:zip(Ts0,Ts1)).
[{1,0.9743474730177548},
{2,0.9744843782751444},
{3,0.9995902361669045},
{4,0.9738012596572161},
{5,0.9717956667018103},
{6,0.9739235846420741},
{7,0.973237033077876},
{8,0.9741297293248656}]
Using the same snapshots to calculate a total scheduler-utilization.> {A, T} = lists:foldl(fun({{_, A0, T0}, {_, A1, T1}}, {Ai,Ti}) ->
{Ai + (A1 – A0), Ti + (T1 – T0)} end, {0, 0}, lists:zip(Ts0,Ts1)), A/T.
0.9769136803764825
其中要注意的是”scheduler_wall_time is by default disabled. Use erlang:system_flag(scheduler_wall_time, true) to enable it.”。原因是运行期需要去做统计工作会影响性能。而且函数返回的每个调度器的使用情况顺序是乱的,需要排序下。
percept2提供了个percept2_sampling来帮我们可视化这个利用率, 演示如下:
我们启动percept2_sampling收集系统一分钟的数据,然后用web界面查看:
$ erl -pa percept2/ebin
Erlang R15B03 (erts-5.9.3.1) [source] [64-bit] [smp:16:16] [async-threads:0] [hipe] [kernel-poll:false]

Eshell V5.9.3.1  (abort with ^G)
1> percept2:start_webserver(8933).
{started,"rds064076",8933}
2> percept2_sampling:start([all], 60000, ".").
<0.57.0>
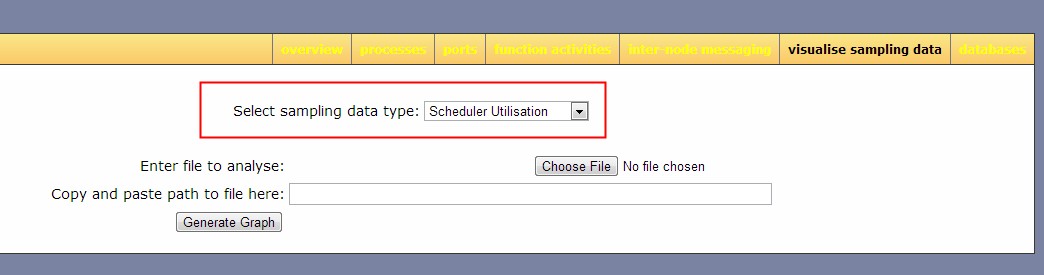
它的操作界面如下:
调度器的利用率效果如图:
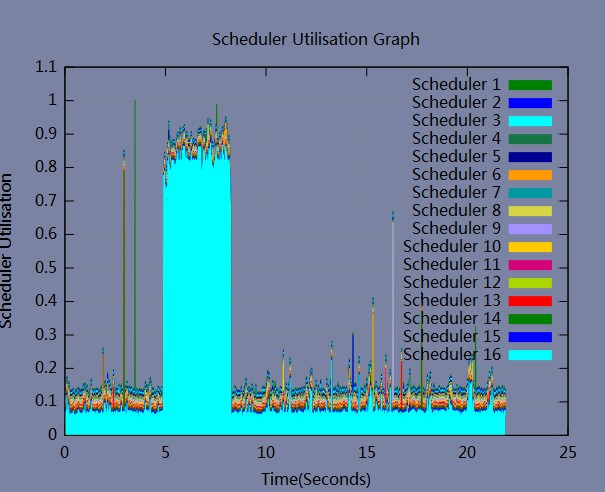
我们可以看到3号调度器比较忙,其他的都闲的。
祝玩得开心!
Post Footer automatically generated by wp-posturl plugin for wordpress.
霸爷,实例里要加”percept2_sampling:stop().”要不没有日志
johncan Reply:
April 16th, 2014 at 10:22 pm
示例
Yu Feng Reply:
April 17th, 2014 at 8:37 pm
多谢指导!
在使用中遇到些问题
visualise_sampling_data_page–>scheduler_utilisation–>
Enter file to analyse: 这个留空
Copy and paste path to file here:/dist/src/sample_scheduler_utilisation.dat
点击“Generate Graph”,然后出现以下错误:
http://pastebin.com/dgH2p7SL
系统环境是CentOS 6.2 64bit
Erlang R15B03和R16B01都有问题,请指教!
johncan Reply:
April 21st, 2014 at 11:42 am
不好意思,是我没认真阅读文档,我装了graphviz就解决了
遇到个问题,在一台200w长连接网关机器上,cpu 400%,但这个统计出来至少应该2400*77%+(10秒钟的),偶尔会到24*90%+,都是比实际低,高还是第一次遇到;服务处理消息延时抖动厉害,不知道是不是这个统计不准确…
[{total,0.7761295849106257},
{1,0.7756799785099848},
{2,0.7769050445460819},
{3,0.7765452722351729},
{4,0.7746779093871902},
{5,0.7748484381503946},
{6,0.7760273514123966},
{7,0.7761599043571952},
{8,0.7763697765096336},
{9,0.7760360935868226},
{10,0.7753613557115193},
{11,0.7752594067768093},
{12,0.7766551636148914},
{13,0.775979790957442},
{14,0.7754587953229836},
{15,0.7759563269736389},
{16,0.7776179291168467},
{17,0.7766007782564863},
{18,0.776789988233917},
{19,0.776173250027786},
{20,0.7768337339077621},
{21,0.7758725217378645},
{22,0.7752877913435865},
{23,0.7765071473111311},
{24,0.7775063209549725}]